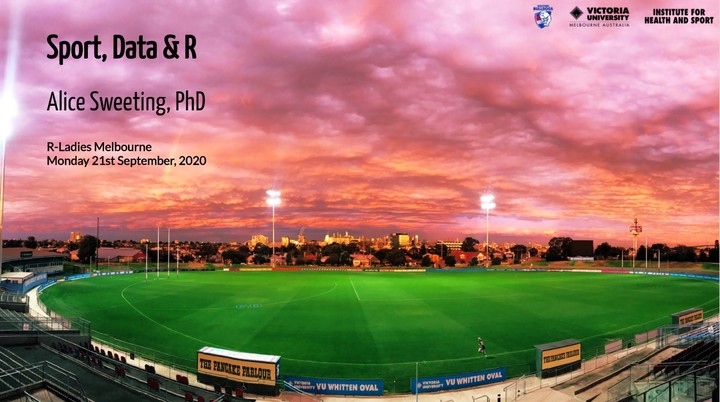
Sport, Data & R

Date
Sep 21, 2020 5:30 PM — 7:30 PM
Event
Location
Online webinar
This online talk was designed to show how R (and the tidyverse) are used to analyse and visualise sport science data.
In this talk, I demonstrate how R is used to analyse and visualise sport science data. Specifically, how the physical and skilled outputs of team-sport athletes can be analysed, using the tidyverse and data mining techniques, to gain insights into matches and training. Data from the 2020 Suncorp Super Netball is presented and visualised.