Suncorp Super Netball - 2020 Grand Final
The 2020 Suncorp Super Netball season has been like no other, with the entire competition relocating to Queensland for a hub-style format of competition. Matches were often played twice per week, with athletes, support staff, umpires, media and league administrators all spending a considerable amount of time away from partners, family and friends. Watching the competition afar, from a COVID troubled Melbourne in Victoria, has been inspiring and uplifiting during a gloomy year. The statistics, collected by Champion Data, during every quater, match and round of the 2020 season have also been exciting to watch unfold. Here, I dig into some key statistics, mainly using the tidyverse and the wonderful superNetballR package by Steve Lane ahead of the 2020 Grand Final. I have included code alongside all tables and visualisations, so any #RStats users can reproduce.
The 2020 Suncorp Super Netball Grand Final will be contested between the West Coast Fever and the Melbourne Vixens. Both teams have spent a substantial period of time away from home and will not want to return empty-handed. Before we look at the key statistics for both teams, let’s first look at how the regular (home and away is probably not a suitable descriptor here!) season unfolded. Firstly, upon completion of Round 14 and the regular season, the key team statistics.
Team Season Data
Here we see that the Fever have the most goals from centre pass, gain and turnover, at 641, 137 and 132, respectively. Clearly, they score strongly off their own centre pass and punish opposing teams for turning the ball over. The Vixens are third in the league for goals from centre pass and second at goals from gain, so also know how to make use of the centre pass and when opposing teams turn the ball over. Interestingly, the Fever and Vixens sit at fourth and fifth in the league for intercepts, yet the Fever lead the competition for gains at an impressive 210 efforts to win the ball back. The Vixens lead the competition for pickups (or to quote LLL, bin chickens!) at 188 secures of possession of a loose ball to be won. The Fever are the second least costly team in the competition, with only 647 penalties (including obstructions and contacts) compared to the Vixens 726. The Fever also like treasuring the ball, sitting at only 43 bad passes in the league (as of the completion of Round 14) and only one ahead of the team with the least bad passes, the GIANTS.
Click here to view the key team statistics, with code used to create the tables below.
Team Table Code
# Create data
TeamStats2020 <- Season2020_TeamData %>%
   filter(stat %in% c("goalsFromCentrePass",
                      "goalsFromGain", "goalsFromTurnovers",
                      "gain", "intercepts", "pickups", "penalties",
                      "badPasses")) %>%
  group_by(squadNickname, stat) %>%
  summarise(SeasonTotal = sum(Total)) %>%
  pivot_wider(names_from = stat, values_from = SeasonTotal) %>%
  select(squadNickname, goalsFromCentrePass, goalsFromGain,
  goalsFromTurnovers, intercepts, gain, pickups, penalties, badPasses)
# Rename columns
colnames(TeamStats2020) <- c("Club", "Goals From Centre Pass", "Goals From Gain",
                             "Goals From Turnovers", "Intercepts", "Gains", "Pickups", "Penalties", "Bad Passes")
# Rd14 ladder order
TeamStats2020$`Season Finish` <- c(3, 5, 6, 2, 8, 4, 7, 1)
# Create table
reactable(TeamStats2020, pagination = TRUE, minRows = 10, defaultSortOrder = "desc", defaultSorted = "Season Finish", showSortIcon = TRUE, borderless = TRUE, height = 600, highlight = TRUE, searchable = FALSE, defaultColDef = colDef(headerClass = "header", align = "center"),
          columns = list(
            Club = colDef(name = "Club",
                          filterable = TRUE,
                          align = "center",
                          style = list(fontSize = "8px", fontWeight = "bold"),
                          headerStyle = list(fontWeight = 700),
                          cell = function(value) {
                            div(class = "Club",
                                img(class = "logo",
                                    alt = paste(value, "logo"),
                                    src = sprintf("Images/%s.png", value)))},
                          maxWidth = 100)))
Individual Athlete Season Data
We all know the saying about a champion team but the Suncorp Super Netball competition consists of the world’s best players, so let’s take a closer look at their champion individual efforts in season 2020.
Click here to view the key individual athlete statistics, with code used to create the tables below.
Liz Watson and Verity Charles are first and second at 359 and 327 feeds with an attempt, respectively, in 2020. Of note are the other Fever and Vixens athletes in the top 10, with Alice Teague-Neeld and Kate Moloney at 254 and 229, respectively, feeds with an attempt. More on the different circle feeds by Vixens and Fever later! Courtney Bruce is second in the lead for gains and third for intercepts, with Emily Mannix also in the top 10 for both stats. The goal shooting power of Fowler is amazing, with 848 goal attempts in 2020 and 60 rebounds, behind season leader Romelda Aiken. More on the shooting power of Fowler below!
Individual Athlete Table Code
# Create data
AthleteStats2020 <- Season2020_PlayerData %>%
     filter(stat %in% c("feedWithAttempt",
                      "gain", "goalAttempts",
                      "intercepts", "penalties",
                      "rebounds", "minutesPlayed")) %>%
  group_by(squadNickname, shortDisplayName, stat) %>%
  summarise(SeasonTotal = sum(Total)) %>%
  pivot_wider(names_from = stat, values_from = SeasonTotal)
# Rename columns
colnames(AthleteStats2020) <- c("Club", "Athlete", "Feed with Attempt", "Gains",
                             "Goal Attempts", "Intercepts", "Minutes Played", "Penalties", "Rebounds")
# Create table
reactable(AthleteStats2020, pagination = TRUE, minRows = 10, defaultSortOrder = "desc", defaultSorted = "Minutes Played", showSortIcon = TRUE, borderless = TRUE, height = 600, highlight = TRUE, searchable = FALSE, defaultColDef = colDef(headerClass = "header", align = "center"),
          columns = list(
            Club = colDef(name = "Club",
                          filterable = TRUE,
                          align = "center",
                          style = list(fontSize = "8px", fontWeight = "bold"),
                          headerStyle = list(fontWeight = 700),
                          cell = function(value) {
                            div(class = "Club",
                                img(class = "logo",
                                    alt = paste(value, "logo"),
                                    src = sprintf("Images/%s.png", value)))},
                          maxWidth = 100),
            Athlete = colDef(name = "Athlete",
                          filterable = TRUE,
                          align = "center",
                          style = list(fontSize = "18px"),
                          headerStyle = list(fontWeight = 700),
                          maxWidth = 500)))
The Power of Fowler
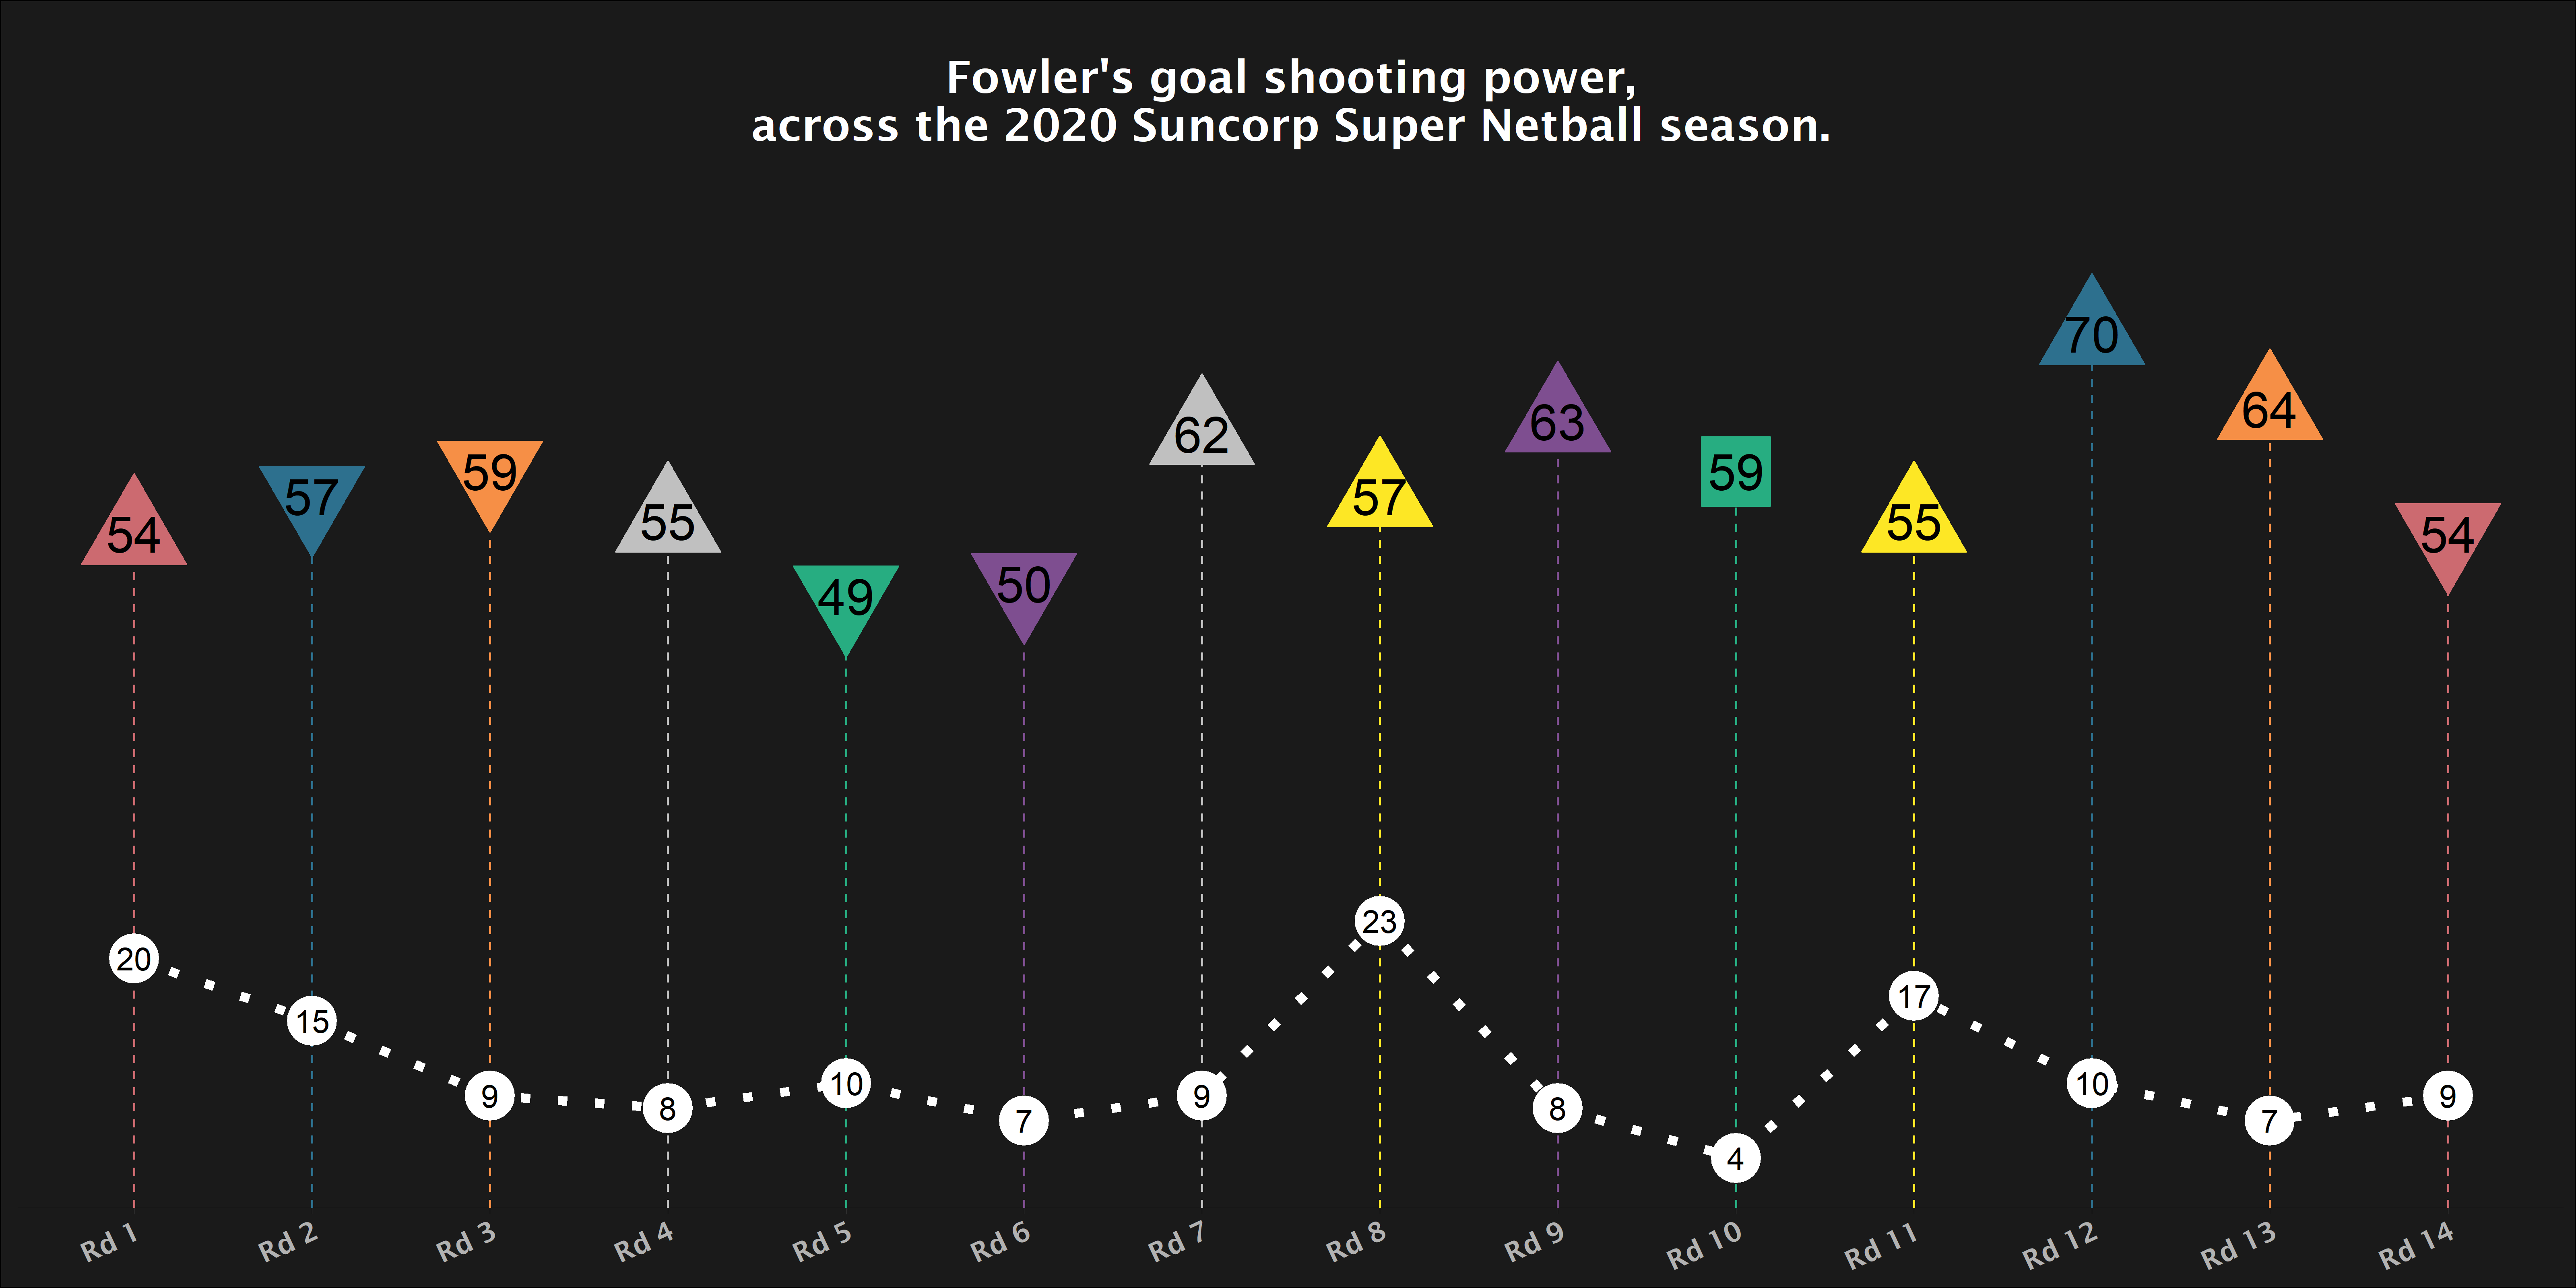
The Fever’s ability to score, off their centre pass and through the turnovers of opposing teams, is largely through the amazing goal scoring capacity of Fowler. Check out Fowler’s scoring ability, over the 2020 season, below. The total goals scored by GA’s during each match is also plotted, in white. An obvious point, but for Vixens to win, history (in 2020!) tells us that they must keep Fowler to < 60 goals and accompaying GA (likely Teague-Neeld) to < 10 goals, which of the below includes the new Super Shot.
Plot
Code
# Filter for GA contribution
FeverGA <- Season2020_PlayerData %>%
filter(shortDisplayName!= "Fowler, J" & squadNickname == "Fever" & stat == "points") %>%
  group_by(round) %>%
  summarise(TotalGA = sum(Total))
# Plot Fowler's scoring ability
Season2020_PlayerData %>%
  filter(shortDisplayName == "Fowler, J" & stat == "points") %>%
  ggplot(aes(x = round, y = Total)) +
  geom_segment(aes(x = round, y = 0, xend = round, yend = Total,
                   colour = Opponent), linetype = "dashed") +
  geom_point(aes(colour = Opponent, fill = Opponent, shape = Outcome), size = 16) +
  geom_text(aes(x = round, y = Total, label = Total), size = 8, colour = "black") +
  geom_path(data = FeverGA, aes(x = round, y = TotalGA), size = 2, colour = "white", linetype = "dotted") +
  geom_point(data = FeverGA, aes(x = round, y = TotalGA), size = 10, colour = "white") +
  geom_text(data = FeverGA, aes(x = round, y = TotalGA, label = TotalGA), size = 5, colour = "black") +
  scale_colour_manual(values = SSN_Colours, na.translate=FALSE) +
  scale_shape_manual(values=c(22, 25, 24), na.translate=FALSE) +
  scale_fill_manual(values = SSN_Colours, na.translate=FALSE) +
  scale_x_continuous(breaks = c(1:14),
                     labels = function(x) paste0("Rd ", x)) +
  scale_y_continuous(expand = c(0,0), limits = c(0, 80)) +
  labs(x = NULL, y = NULL,
       title = "\n Fowler's goal shooting power, \n across the 2020 Suncorp Super Netball season. \n") +
  dark_theme_gray() +
  theme(plot.title = element_text(size = 20, face = "bold", hjust = 0.5),
        plot.background = element_rect(fill = "grey10"),
        panel.background = element_blank(),
        panel.grid.major = element_blank(),
        panel.grid.minor = element_blank(),
        legend.background = element_blank(),
        text = element_text(family = "Lucida Sans"),
        axis.ticks.x = element_line(color = "grey30", size = 0.1),
        axis.line.x =  element_line(color = "grey30", size = 0.1),
        axis.text.x = element_text(size = 12, face = "bold", angle = 25, vjust = 1, hjust = 1),
        axis.ticks.y =  element_blank(),
        axis.title.y = element_blank(),
        axis.line.y = element_blank(),
        axis.text.y = element_blank(),
        legend.title = element_blank(), legend.position = "none")
Who Feeds Who?
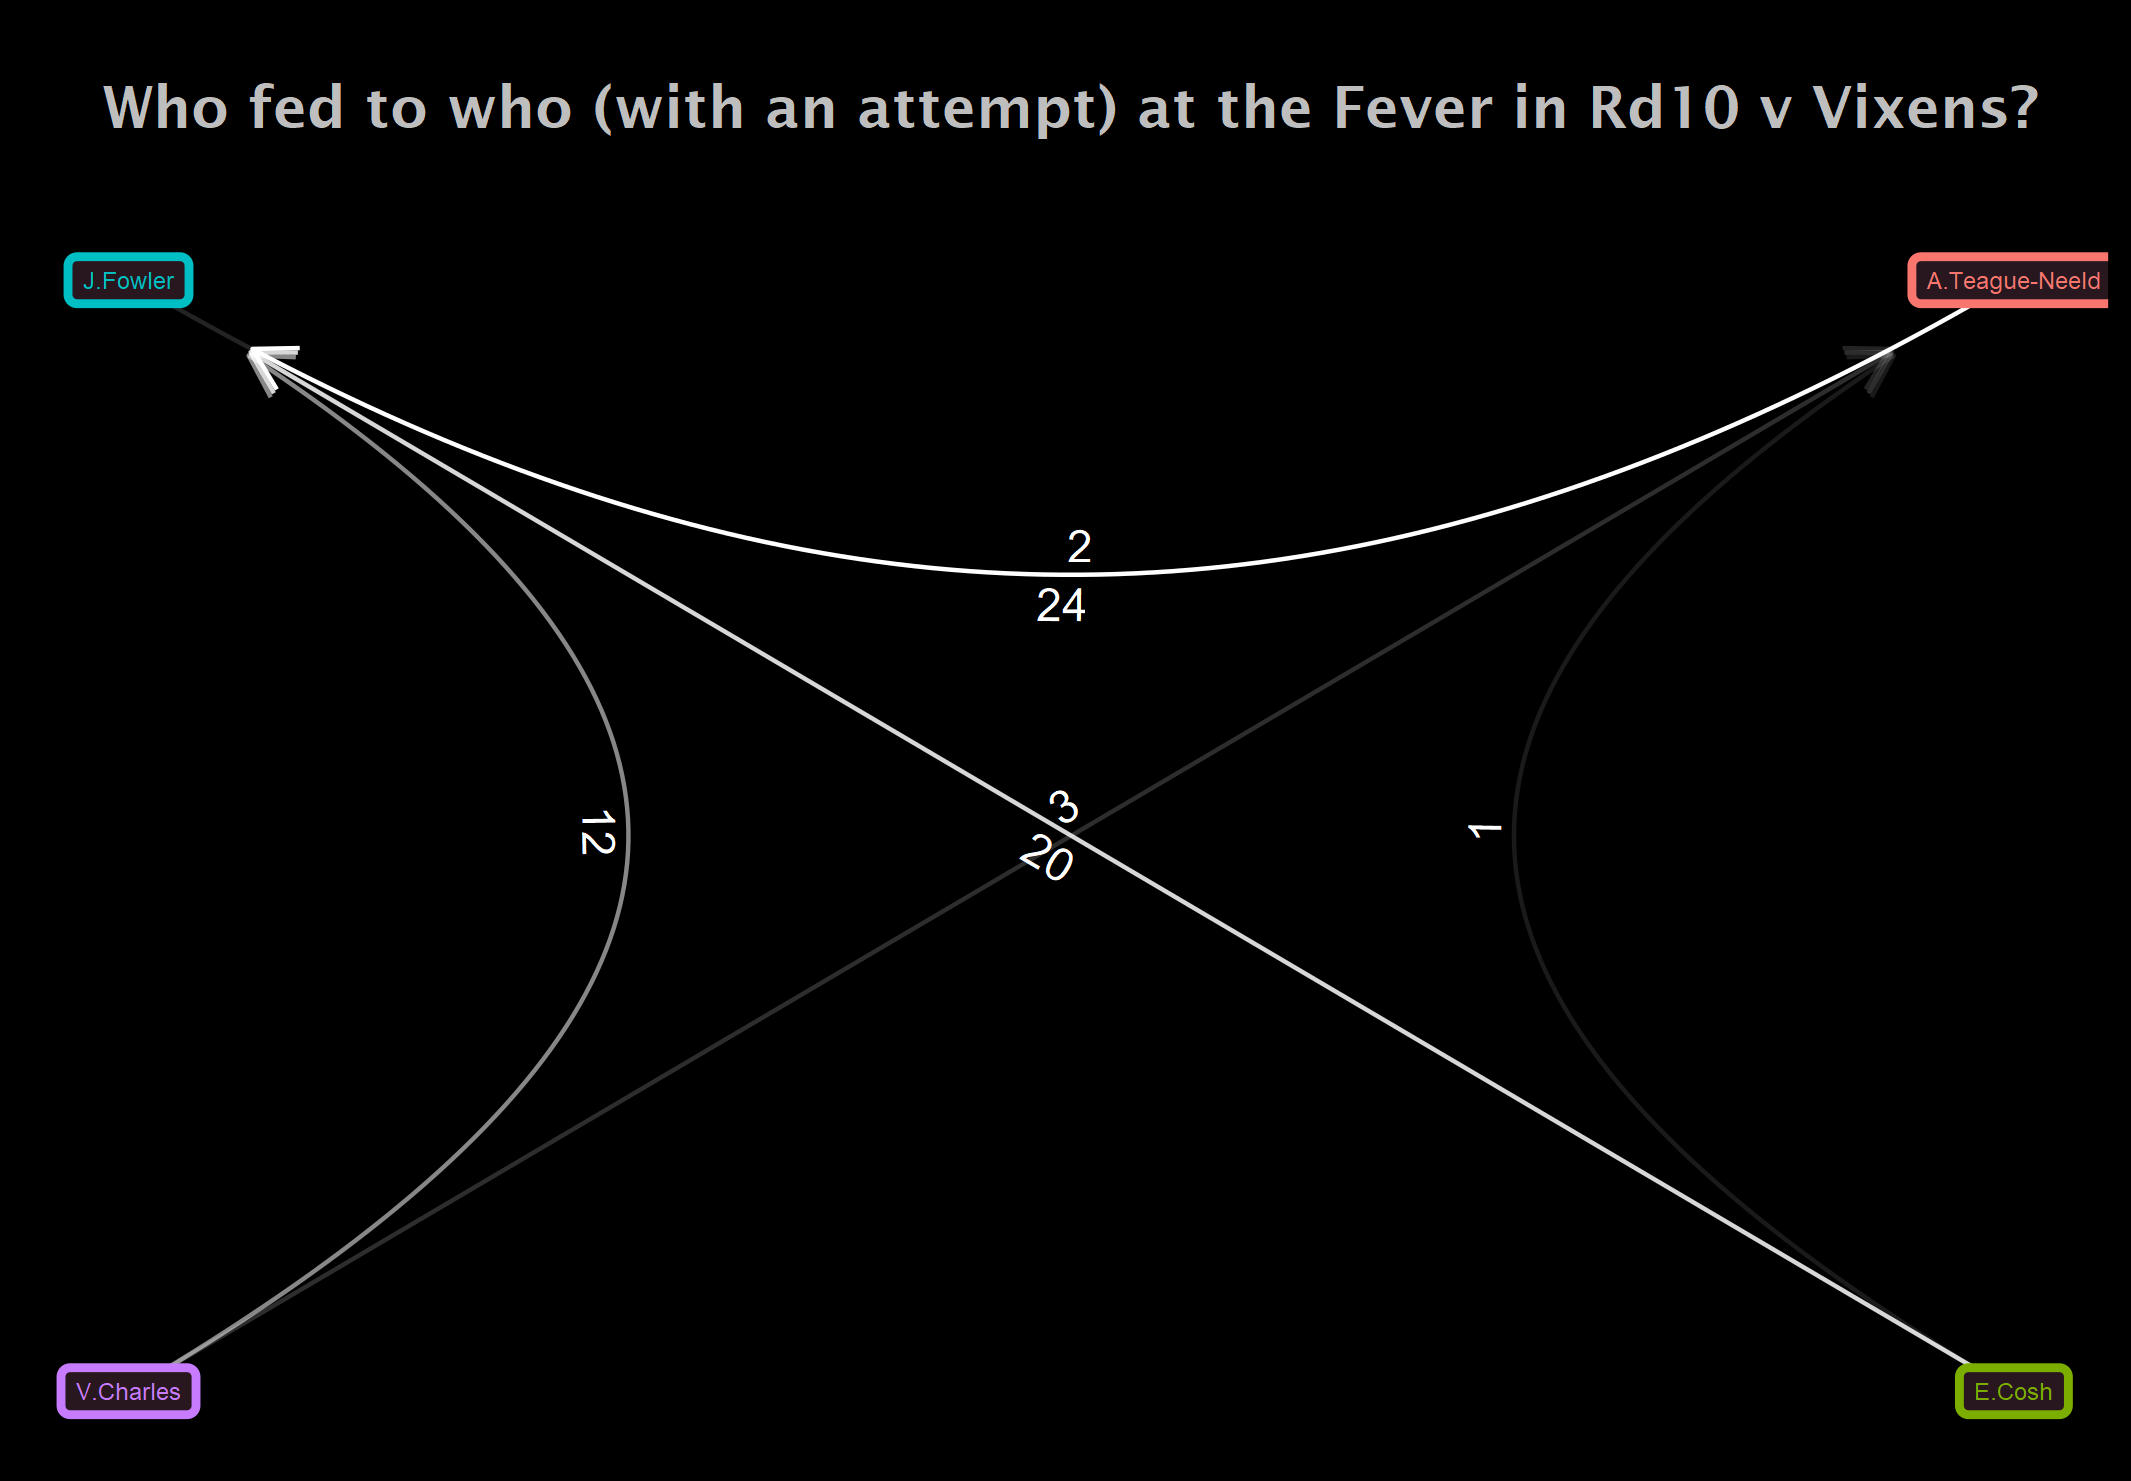
How to stop the Fever? Put pressure on the ball carrier and their pass into the circle! So who feeds the ball into the circle (with an attempt) at the Fever and Vixens? Let’s look at last time they played in Rd10. Here, the stronger the line between players, the more feeds with an attempt. The direction arrows indicate who fed to who, with the number on the connecting line the total number of feeds. We can see that from this figure, Alice Teague-Neeld (n = 24), Verity Charles (n = 12) and Emma Cosh (n = 20) all fed the ball into Fowler, who subsequently had an attempt. There were only n = 6 total feeds from Cosh, Charles and Fowler into Teague-Neeld.
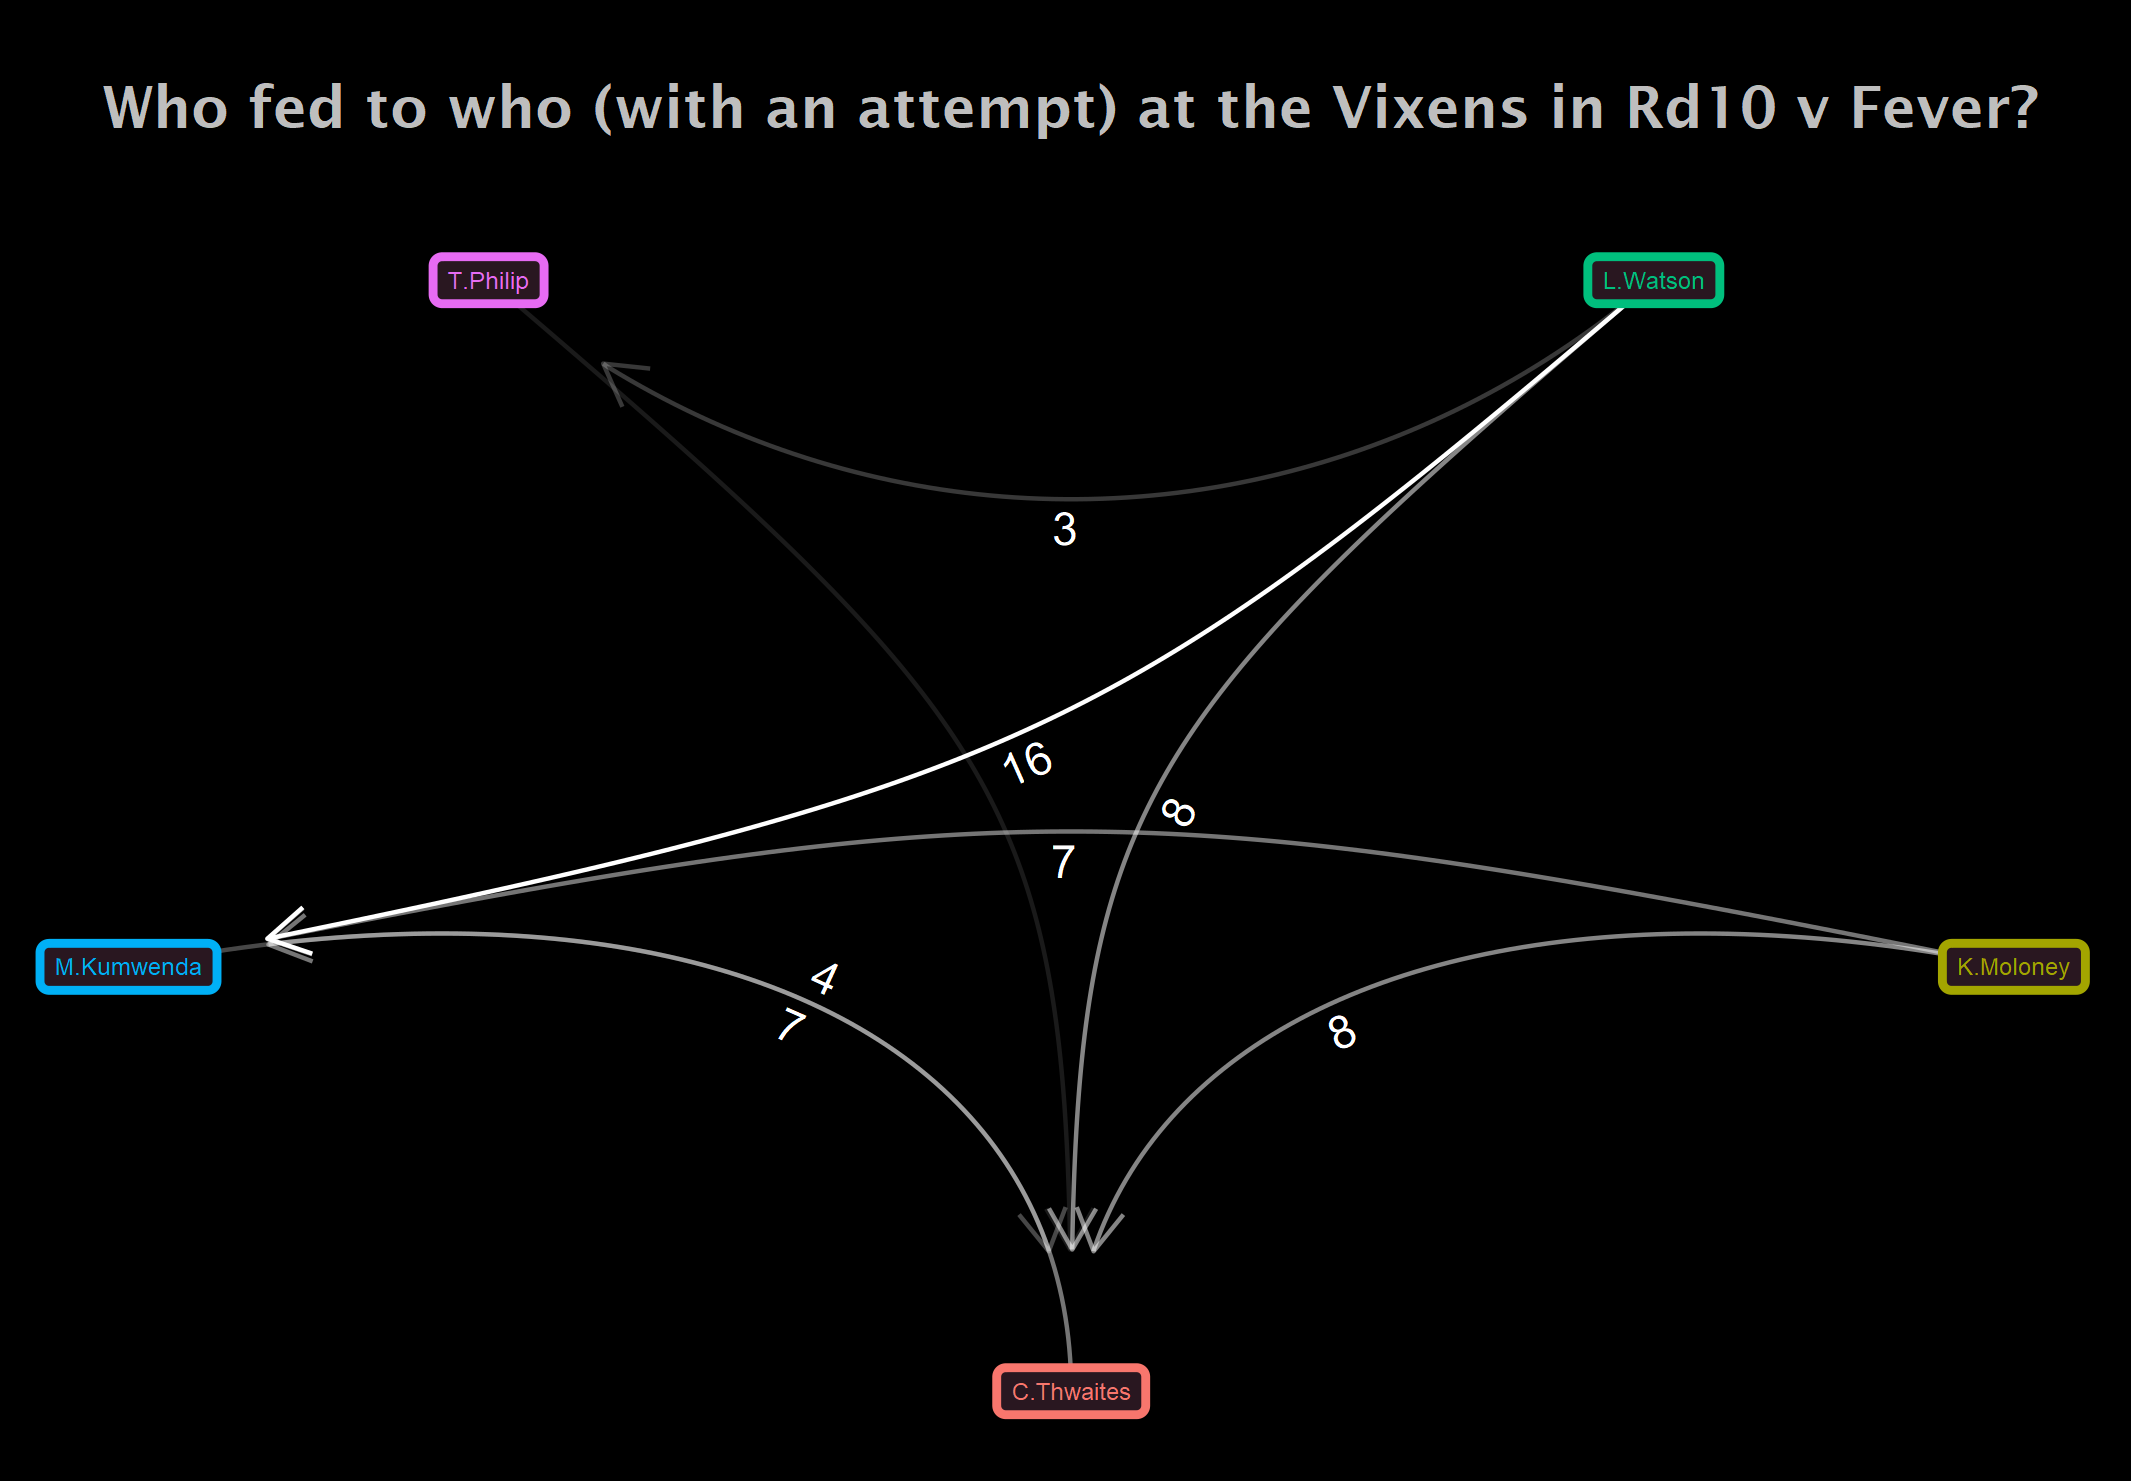
The Vixens, on the other hand, have more variability in their circle feeding, where Liz Watson and Kate Moloney had n = 23 feeds (with an attempt) into Mwai Kumwenda. Alternatively, they also had 8 feeds each into Caitlin Thwaites, who herself had n = 7 feeds (with an attempt) into Mwai. Although Liz Watson is the Vixen’s main circle feeder, who in this match alone had an impressive 27 feeds (with n = 3 additional feeds on the above, into Teagn Philip), there is more versatility in who is fed the ball with an attempt.
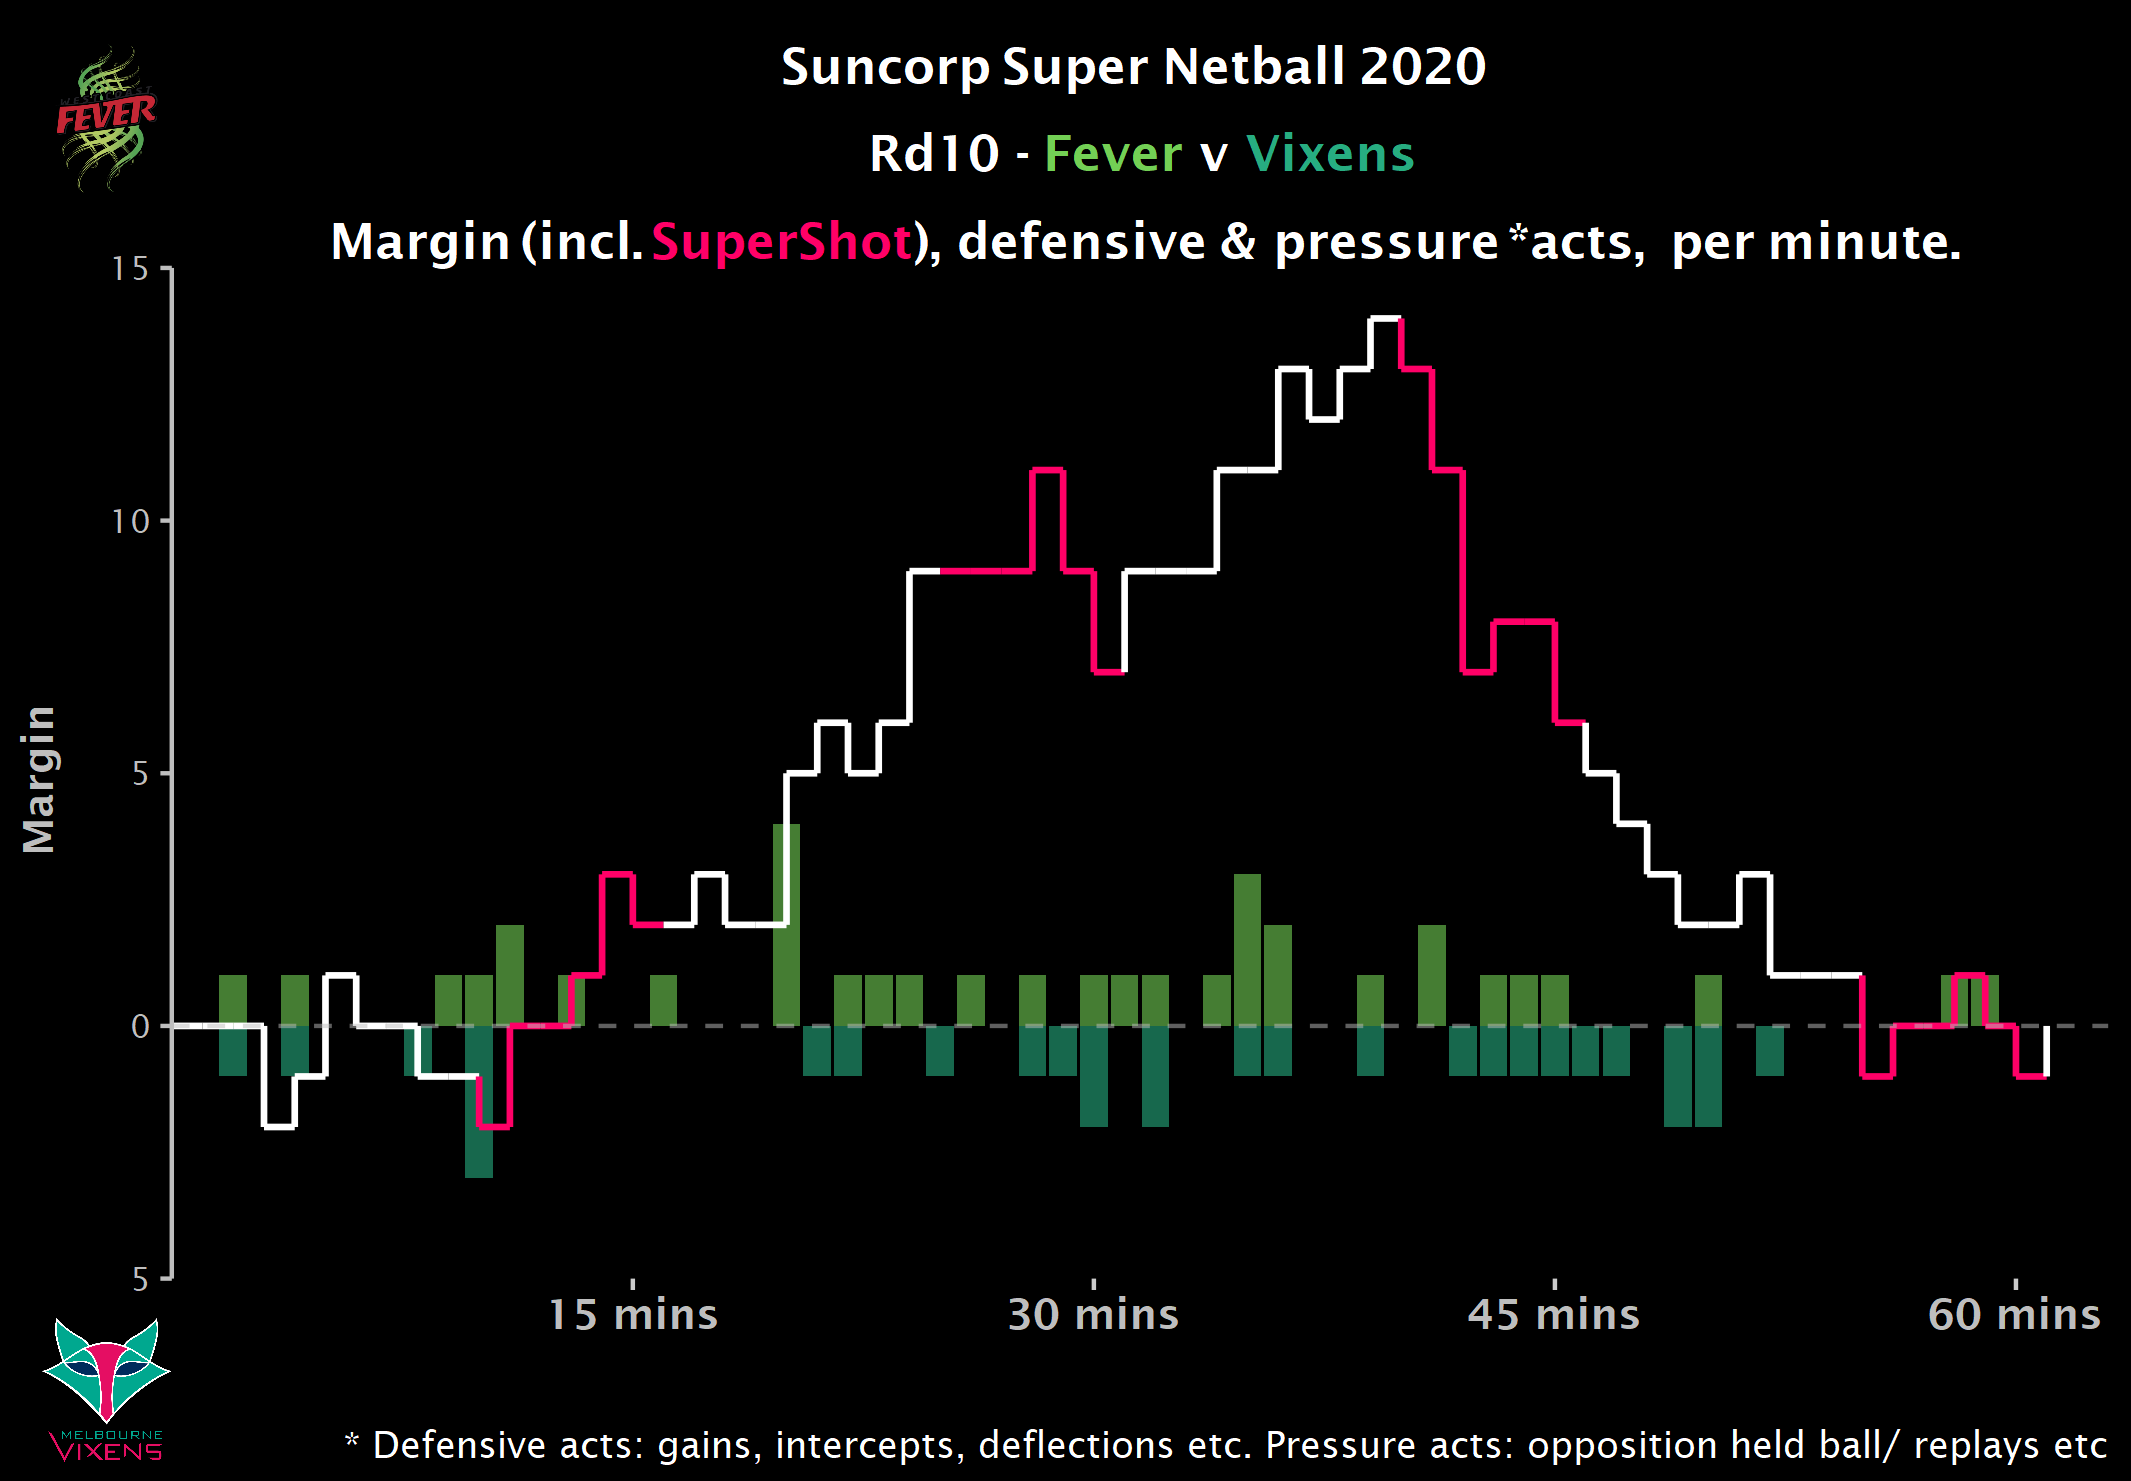
A Draw, but a Vixens “win” in Rd10?
The Rd10 match between the Vixens and Fever was a thrilling draw, whereby the Fever lead by 14 goals 8 minutes and 36 seconds into the third quarter, only for the Vixens to claw their way back, mainly via the Super Shot but also by their impressive defensive efforts. The Vixens converted an impressive 100% of their goals (n = 7) from gain that match and although a draw is an annoying result, the ability of the Vixens to pull their way back into the game is impressive and it almost felt as though they had the upper hand when the final siren went in Rd10. So, how did the Rd10 match unfold? Below is a visualisation of score per minute (the white, stepped line) plotted against the number of defensive and pressure acts per minute, as bars.
What constitutes a defensive act? When a team has any of;
- Intercepts
- Deflection Gains
- Gains
- Defensive Rebounds
- Pick ups
What constitutes a pressure act? When the opposing team has any of;
- A held ball
- A ball thrown over the third
- A break on their centre pass
- A step
- A touched/ fumbled ball out of court
- A step out of court with the ball
- A replayed ball
The above is arbitary and very likely not perfect! But scaling this, per minute, provides some context on how much pressure a team can put on their opposition, by doing defensive or pressure type things. A look at the visual below and whilst it is clear the Super Shot allowed the Vixens back into the game, their defensive pressure towards the end of Q3 and throughout Q4 clearly disrupted Fever’s ability to score.
Who Will Win the 2020 Suncorp Super Netball Grand Final?
The Melbourne Vixens and the West Coast Fever were the two best teams in the 2020 competition. As Liz Ellis recently wrote, grand finals are won not by relying on your season statistics and I am so excited to watch what promises to be a thrilling match. My tip? The Melbourne Vixens, who have become become the real deal after years of underachievement. As a Victorian and Melbourne resident, watching the Vixens on from a city locked down due to the coronavirus, has been uplifting and so hopefully it will be a case of #VicsDoItBetter on the 18th of October, 2020.
If the above analysis and visualisations in #RStats have made you curious about sport science and analytics, please check out our sport performance courses at Victoria University, along with new postgraduate offerings in the sports analytics space, beginning in 2021!